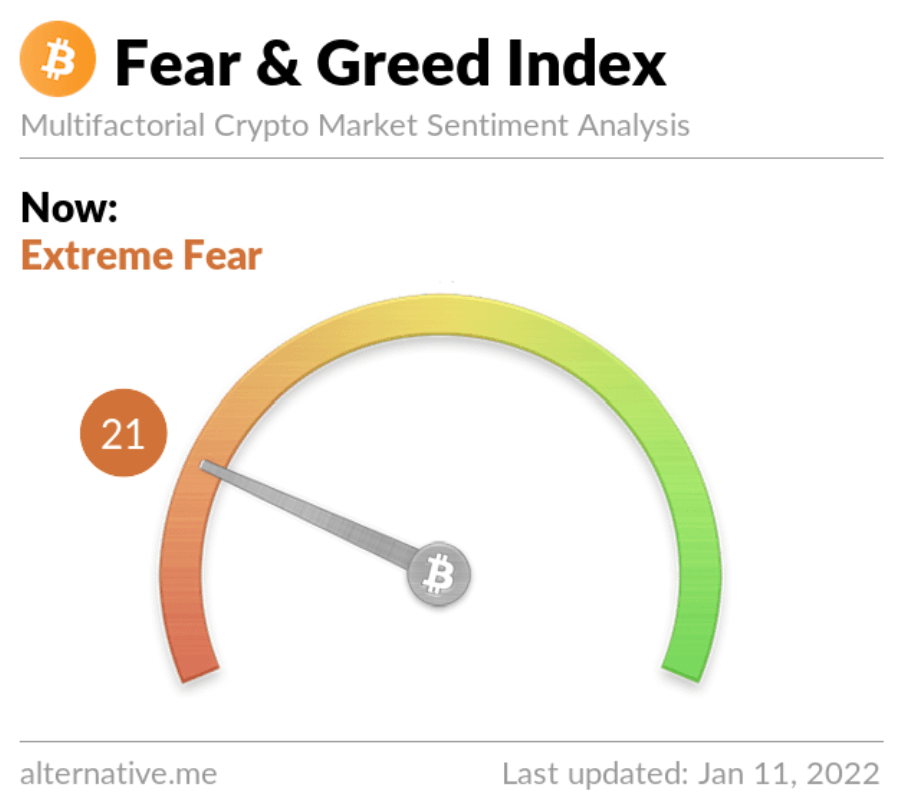
If you have spent anytime around the crypto-verse you have seen the Bitcoin Fear & Greed Index.
If you are like most people, when numbers go up, you get massive FOMO and buy in (probably near the top). But when the day looks like a sea of red, you panic sell (probably at the bottom). Then you wait and buy back again at a higher price when you start hearing of all the crypto-riches everyone is making.
The Bitcoin Fear & Greed Index is supposed to help you be a slightly less terrible investor. If you see the market is full of greed, you know it may not be a good time to buy. Whereas, when there is lots of fear (the proverbial ‘blood in the streets’), you know it may be a good time to buy.
But have you ever wondered what it is? Or How it is calculated?
More importantly, has the index been actually useful historically?
Lets take a look.
What is the Bitcoin Fear & Greed Index?
The Bitcoin Fear & Greed Index was created by Alternative.Me in an attempt to measure the sentiment around Bitcoin.
The Fear & Greed Index is a multifactorial model of sentiment analysis. Multifactorial just means that it considers more than 1 factor and takes a weight of each factor to get a single output.
The index ranges from 0 to 100 where lower numbers indicate more fear in the market and higher numbers corresponding with greed.
The expectation would be that when the index shows fear, the market is oversold and it is a good time to buy. Conversely, when the index is high, the market is overbought, and it is a good time to sell. This of course assumes you are a trader and not just looking to stack & HODL your Bitcoin as a store of value.
Side note: HODL is an acronym for ‘Hold On for Dear Life’ and not a funny misspelling to mock people in crypto forums

What Factors go into the Fear & Greed Index?
The Bitcoin Fear & Greed Index is made up of 6 factors with 10-25% weighting on each. The 6 factors in the multifactor model are:
- Volatility (25%) – Current volatility and max. drawdowns on Bitcoin compared to trailing 30 & 90-day averages. Rising volatility & drawdowns are considered a sign of more fear in the market and a lower score.
- Market Momentum & Volume (25%) – Current volume and momentum compared to trailing 30 & 90-day averages. When the volume is high in a rising market it is a sign of increasing greed.
- Social Media (15%) – Currently this is a twitter only measure with reddit being added in the future. This measure the interactions received on posts with specific hashtags. High interaction rates and quick interaction times on a post is a sign of a greedy market and higher score.
- This corresponds to how cryptotwitter is full of pumpers in the bull market and then crickets when in the bear
Surveys (15%)– Currently, the survey part of the index is paused and not included. Weekly crypto polls were taken and gather 2,000-3,000 votes. These surveys were used to gauge sentiment. There is not a published time frame to turn the surveys back on currently.
- Dominance (10%) – Measures Bitcoin’s share of the entire crypto market. The theory here is that when people are more fearful the start rotating to blue chip stores of value like Bitcoin. However, when Bitcoin’s market share decreases it means people are chasing alt-coins and being greedy.
- Trends (10%) – This factor is based off Google Trends data pulls on numerous searches related to Bitcoin. The factor is based on both volume and changes in volume. Depending on what the keywords are, depends on if increased volume is a sign of fear or greed.
- For instance, the example they use is for keywords “Bitcoin Price manipulation”. Seeing an uptick in this keyword would indicate more fear in the market.
What do the Different Scores Represent?
In the Fear & Greed Index, the scores are roughly quartiles between the ratings.
| Fear & Greed Index Score | Market Sentiment |
| 0-25 | Extreme Fear |
| 26-46 | Fear |
| 47-54 | Neutral |
| 55-75 | Greed |
| 76-100 | Extreme Greed |
If the index should is a good predictor, we would expect to see extreme fear and extreme greed precede corrections in BTC. Do we?
Historical Accuracy of Fear And Greed Index:
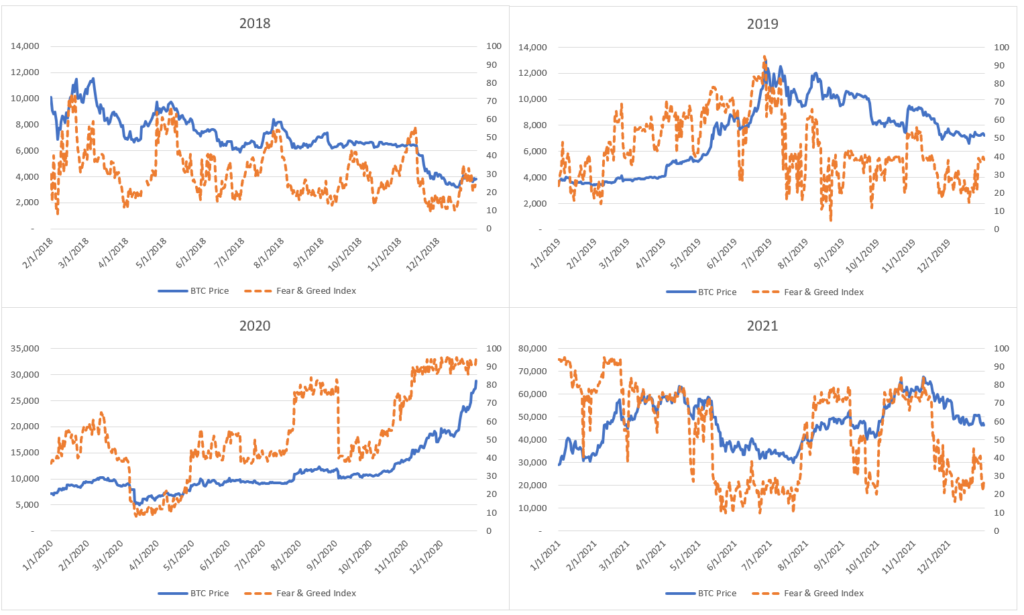
The Fear & Greed Index has data going back to 2/1/2018, so nearly 4 years. Historically, how has it measured up?

I was surprised that the Fear & Greed Index is as responsive to changes in the price as it is. I was expecting the index to be similar to X-day moving average, but when there is a large volatile move in BTC price, the index also makes a large day over day change.
However, I am not sure how helpful it is to be that after a 20% move in a day, to be told that market sentiment is getting extreme. (ie – that doesn’t seem helpful from a predictive stand point)
Trading On Bitcoin Fear & Greed Index
Note – To all reply guys who are going to comment about their technical analysis prowess, these are basic trading strategies for illustration purposes. We all definitely believe you buy every bottom and sell every top every time 100%.
So first glance, the Bitcoin Fear & Greed Index looks like it may be helpful. I set up 2 different strategies and ran them through the data to see if trading around the index could outperform Buy & Hold since its inceptions.
Strategy 1: Buy when the index indicates extreme fear (<26) and sell when index indicates extreme greed (>76).
Strategy 2: Buy when the index indicates extreme fear (<26) and sell when it indicates greed (>55). Then short when the index indicates extreme greed (>76) and close the short when the index indicates fear (<47).
How did the 2 strategies line up? Terrible. The answer is absolutely terrible.

These results were so shockingly bad. Using the Fear & Greed Index (FGI) to inform your buy and sell decisions results in tremendous underperformance.
How is this possible when the index appeared to line up fairly well with highs and lows in the charts above?
The Flaw in Using Bitcoin Fear & Greed Index to Trade
The Fear & Greed Index does a good job capturing a snapshot of market sentiment, however in a trending environment, the index would have you buy or sell too soon.
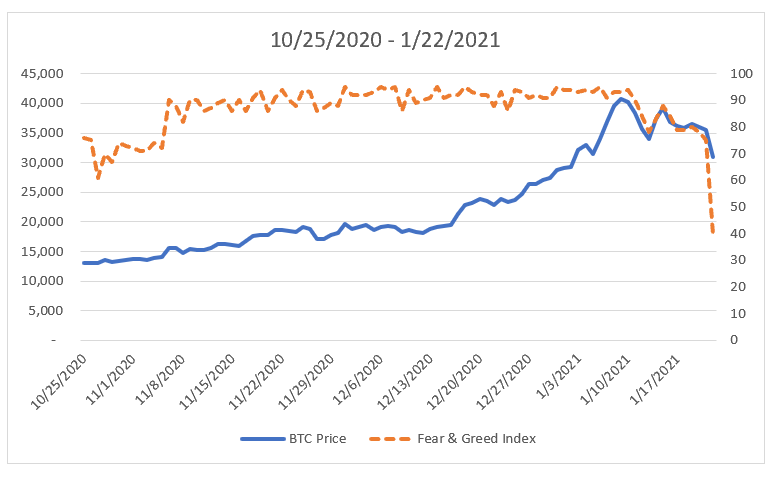
The best example of this is during the October 25, 2020 to Jan 22, 2021 bull run. In late Oct 2020 the Fear & Greed Index hit the extreme greed range and stayed in the high to extreme greed till the end of January.
During this time, BTC was up only, running from a little below $15,000 to touching over $40,000. Any strategy looking at the index and selling when greed was high would have missed out on this massive run.
Strategy 2 did even worse, as you would have been actively shorting BTC in October during greed and got crushed.

Combing through the trades, selling too early happens fairly often in both Fear & Greed Index strategies. Additionally, it can happen when the index is low too.

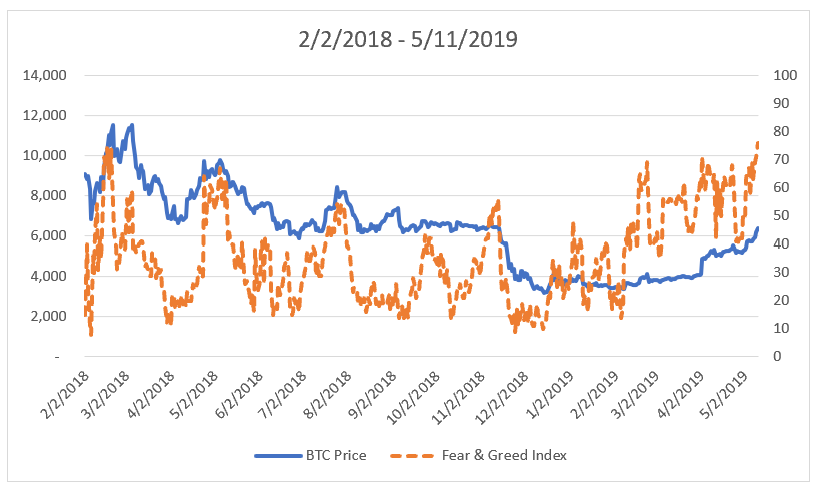
The Index drops into extreme fear in early February in the $8-9,000 BTC price. For over a year, BTC was choppy on a downward trend until April 2019 when it reversed and started going up.
But the Fear & Greed Index got into extreme greed when the price was still sub $7,000, indicating a sell. The price continued to increase to over $12,000.
There are many more examples of similar patterns in the nearly 4 year period. But suffice to say, buying at $9k and selling at $7k and then sitting out on a tripling of the price are all good ways to underperform a Buy & Hold strategy.
Wrapping Up on the Bitcoin Fear & Greed Index
The Bitcoin Fear & Greed Index does seem to do a good job capturing the local market sentiment. However, as a trading indicator it appears to be less useful.
Just because the market sentiment is greedy or fearful, doesn’t mean it can continue to be so for months.
Lastly, one other major issue with the index is that “money has to go somewhere”. Does low FGI scores indicate fear in overall crypto market or just indicate people are rotating from BTC to alternative coins?
Similarly, when the index indicates greed does that mean people are rotating gains from smaller coins to BTC as a risk-off or is the whole market pumping?
Questions for Plato.
At least next time you see someone on crypto-twitter pull out the Bitcoin Fear & Greed Index to support their buy or sell recommendations you know to safely ignore it as it has historically been a poor predictor of future performance.


